<?xml version="1.0" encoding="utf-8"?><feed xmlns="http://www.w3.org/2005/Atom" ><generator uri="https://jekyllrb.com/" version="3.10.0">Jekyll</generator><link href="https://aaronspringer.org/feed.xml" rel="self" type="application/atom+xml" /><link href="https://aaronspringer.org/" rel="alternate" type="text/html" /><updated>2026-07-06T03:40:37+00:00</updated><id>https://aaronspringer.org/feed.xml</id><title type="html">Aaron Springer</title><subtitle>Human-Centered AI Researcher</subtitle><entry><title type="html">Learning By Doing Part 1: Linear Regression from Scratch</title><link href="https://aaronspringer.org/linear-regression/" rel="alternate" type="text/html" title="Learning By Doing Part 1: Linear Regression from Scratch" /><published>2021-07-23T12:19:00+00:00</published><updated>2021-07-23T12:19:00+00:00</updated><id>https://aaronspringer.org/linear-regression</id><content type="html" xml:base="https://aaronspringer.org/linear-regression/"><![CDATA[<p>I want to outline a few of the things that I learned (or rediscovered since my last stats course) in the process of building a linear regression model from scratch. Building a regression model from scratch was step 1 in my process of building up a logistic mixed model from scratch, as I <a href="/regression-plan/">outlined previously</a>.</p>

<p>You can find my code on <a href="https://github.com/ALSpringer/regression_models/blob/main/regression_functions.ipynb">github</a>. In order to meet my goal, this regression model does a few simple things:</p>
<ol>
  <li>Estimate coefficients for intercept and none to multiple regressors against a target variable</li>
  <li>Bootstrap confidence intervals for coefficients in point 1.</li>
  <li>Calculate an overall p-value for the model</li>
</ol>

<p>In the <a href="https://github.com/ALSpringer/regression_models/blob/main/regression_functions.ipynb">notebook</a> you can also see the comparison of this output compared to statsmodels. It’s identical aside from the rounding.</p>

<h2 id="what-i-learned-in-this-process">What I Learned in This Process</h2>
<p><strong>Multiple linear regression is quite simple to compute</strong></p>

<p>I always knew multiple linear regression had a closed form solution but it feels like quite something else to see that you can calculate about any linear regression in &lt; 10 lines of code with numpy. Linear regression has substantial power (I still use it often) and it is really cool to see that it boils down to just a few high level linear algebra operations. This feeling is a total matter of perspective though, if I was writing the numpy inverse matrix function I may not feel quite the same.
The resource I found most helpful in writing this original function was some <a href="https://online.stat.psu.edu/stat462/node/132/">Penn State graduate course online material</a>.</p>

<p><strong>Bootstrapping is more complex than meets the eye</strong></p>

<p>If you’re not familiar, bootstrapping is a method to sample from the original data with replacement and refit the specified model a bunch of times. This resampling and refitting ends up being an accurate way to estimate variability of coefficients and test statistics.
I often feel like bootstrapping is a tool that folks grab for quickly—’Oh, just bootstrap it’. However, going through this process of writing a bootstrap function made me realize there are a multitude of ways to bootstrap and that it can really matter which one you choose. I mainly used some <a href="https://ocw.mit.edu/courses/mathematics/18-05-introduction-to-probability-and-statistics-spring-2014/readings/MIT18_05S14_Reading24.pdf">MIT lecture notes(pdf warning)</a> to learn the specifics when coding. I chose to code the empirical bootstrap as a matter of simplicity but I could have also chosen parametric, semi-parametric, or percentile based bootstrap functions.</p>

<p><strong>Overall p-values for models are just a comparison against a dummy baseline</strong></p>

<p>My final learning I want to note is how we calculate an overall p-value for a multiple linear regression. The p-value for the overall model is roughly answering the question ‘Is there a relationship between the predictors and target variable that is stronger than we could expect by pure chance alone?’ The dummy baseline part of this comparison is what struck me while I was writing this code. My graduate coursework was much more on the <a href="https://projecteuclid.org/download/pdf_1/euclid.ss/1009213726">algorithmic modeling culture</a>(read: machine learning) than the traditional statistics culture of making assumptions about how data is generated. So seeing that an overall p-value is just a comparison of the full multiple regression model with intercept and predictors against a ‘restricted model’ of only the intercept was interesting. It reminded me of how machine learning papers (at least when I was still reading them) often assume a naive baseline to compare a new model against. Of course this makes sense, it’s likely that the machine learning literature drew from traditional statistics parallels when creating these methods.</p>

<p>Writing this up took me longer to get to than expected. Likely because I took too much of my own advice about <a href="/do-something-unproductive/">doing something unproductive</a>, however I’m still committed to finishing this series. Part two, logistic regression, coming soon!</p>]]></content><author><name>aaronspringer</name></author><category term="blog" /><summary type="html"><![CDATA[I want to outline a few of the things that I learned (or rediscovered since my last stats course) in the process of building a linear regression model from scratch. Building a regression model from scratch was step 1 in my process of building up a logistic mixed model from scratch, as I outlined previously. You can find my code on github. In order to meet my goal, this regression model does a few simple things: Estimate coefficients for intercept and none to multiple regressors against a target variable Bootstrap confidence intervals for coefficients in point 1. Calculate an overall p-value for the model In the notebook you can also see the comparison of this output compared to statsmodels. It’s identical aside from the rounding. What I Learned in This Process Multiple linear regression is quite simple to compute I always knew multiple linear regression had a closed form solution but it feels like quite something else to see that you can calculate about any linear regression in &lt; 10 lines of code with numpy. Linear regression has substantial power (I still use it often) and it is really cool to see that it boils down to just a few high level linear algebra operations. This feeling is a total matter of perspective though, if I was writing the numpy inverse matrix function I may not feel quite the same. The resource I found most helpful in writing this original function was some Penn State graduate course online material. Bootstrapping is more complex than meets the eye If you’re not familiar, bootstrapping is a method to sample from the original data with replacement and refit the specified model a bunch of times. This resampling and refitting ends up being an accurate way to estimate variability of coefficients and test statistics. I often feel like bootstrapping is a tool that folks grab for quickly—’Oh, just bootstrap it’. However, going through this process of writing a bootstrap function made me realize there are a multitude of ways to bootstrap and that it can really matter which one you choose. I mainly used some MIT lecture notes(pdf warning) to learn the specifics when coding. I chose to code the empirical bootstrap as a matter of simplicity but I could have also chosen parametric, semi-parametric, or percentile based bootstrap functions. Overall p-values for models are just a comparison against a dummy baseline My final learning I want to note is how we calculate an overall p-value for a multiple linear regression. The p-value for the overall model is roughly answering the question ‘Is there a relationship between the predictors and target variable that is stronger than we could expect by pure chance alone?’ The dummy baseline part of this comparison is what struck me while I was writing this code. My graduate coursework was much more on the algorithmic modeling culture(read: machine learning) than the traditional statistics culture of making assumptions about how data is generated. So seeing that an overall p-value is just a comparison of the full multiple regression model with intercept and predictors against a ‘restricted model’ of only the intercept was interesting. It reminded me of how machine learning papers (at least when I was still reading them) often assume a naive baseline to compare a new model against. Of course this makes sense, it’s likely that the machine learning literature drew from traditional statistics parallels when creating these methods. Writing this up took me longer to get to than expected. Likely because I took too much of my own advice about doing something unproductive, however I’m still committed to finishing this series. Part two, logistic regression, coming soon!]]></summary><media:thumbnail xmlns:media="http://search.yahoo.com/mrss/" url="https://aaronspringer.org/assets/images/markdown.jpg" /><media:content medium="image" url="https://aaronspringer.org/assets/images/markdown.jpg" xmlns:media="http://search.yahoo.com/mrss/" /></entry><entry><title type="html">Learning by Doing: Logistic Mixed Models</title><link href="https://aaronspringer.org/regression-plan/" rel="alternate" type="text/html" title="Learning by Doing: Logistic Mixed Models" /><published>2021-05-23T12:19:00+00:00</published><updated>2021-05-23T12:19:00+00:00</updated><id>https://aaronspringer.org/regression-plan</id><content type="html" xml:base="https://aaronspringer.org/regression-plan/"><![CDATA[<p>I’m in a weird stage right now. I use a lot of complex statistics at work regularly, but I’ve learned most of them through pragmatic means and without a lot of formal education. I am quite careful that I do my due diligence on assumptions, model checking, and such but I’m dissatisfied with my root understanding on how some of these models work. Specifically I’m thinking about some of the generalized linear mixed models I’ve been using recently. I often have questions that I need to look up that I should perhaps know the answer from first principles if I understood the underlying estimation procedure better.</p>

<p>I’ve become a lot more knowledgeable about mixed-models recently, but I’ve also realized how little I really know. I’m also dissatisfied with the state of doing this type of modeling in Python; statsmodels is a fantastic package but the support for generalized linear mixed models feels sparse compared to R’s fantastic glmer package.</p>

<p>I’m setting out to code a logistic mixed-model from scratch in order to better understand how these models are estimated. Maybe one day I’ll be able to contribute back to statsmodels but I’m afraid those folks are much smarter than I am when it comes to stats packages.</p>

<p>I see a natural progression here that I’m hoping to follow:</p>
<ol>
  <li>Create a function for estimating basic multiple linear regression models</li>
  <li>Create a function for estimating linear mixed models</li>
  <li>Create a function for estimating logistic mixed models</li>
</ol>

<p>To be honest, I don’t know what I don’t know. This could take much longer than I’m expecting. And I do believe there is a bit of a disconnect between points 1 and 2. I think I’ll have to move from being able to directly calculate the model to an iterative estimation process but I’d like to get a small win first with the multiple regression before moving on.</p>

<p>I want to set out some requirements for the first multiple regression stage so I can hold myself to them:</p>
<ol>
  <li>The regression function should produce coefficient estimates nearly identical to lm() in R</li>
  <li>The function should also produce 95% confidence intervals for the coefficient estimates. I’d like to estimate these via bootstrapping but we will see.</li>
  <li>The regression function should also produce an overall p-value for the model.</li>
  <li>“From scratch” here is a bit ill-defined but I intend to write this at the level of calling the matrix operations from a package like numpy but not writing my own matrix inversion function or the like.</li>
</ol>

<p>I’ll provide updates on the process as I go.</p>]]></content><author><name>aaronspringer</name></author><category term="blog" /><summary type="html"><![CDATA[I’m in a weird stage right now. I use a lot of complex statistics at work regularly, but I’ve learned most of them through pragmatic means and without a lot of formal education. I am quite careful that I do my due diligence on assumptions, model checking, and such but I’m dissatisfied with my root understanding on how some of these models work. Specifically I’m thinking about some of the generalized linear mixed models I’ve been using recently. I often have questions that I need to look up that I should perhaps know the answer from first principles if I understood the underlying estimation procedure better. I’ve become a lot more knowledgeable about mixed-models recently, but I’ve also realized how little I really know. I’m also dissatisfied with the state of doing this type of modeling in Python; statsmodels is a fantastic package but the support for generalized linear mixed models feels sparse compared to R’s fantastic glmer package. I’m setting out to code a logistic mixed-model from scratch in order to better understand how these models are estimated. Maybe one day I’ll be able to contribute back to statsmodels but I’m afraid those folks are much smarter than I am when it comes to stats packages. I see a natural progression here that I’m hoping to follow: Create a function for estimating basic multiple linear regression models Create a function for estimating linear mixed models Create a function for estimating logistic mixed models To be honest, I don’t know what I don’t know. This could take much longer than I’m expecting. And I do believe there is a bit of a disconnect between points 1 and 2. I think I’ll have to move from being able to directly calculate the model to an iterative estimation process but I’d like to get a small win first with the multiple regression before moving on. I want to set out some requirements for the first multiple regression stage so I can hold myself to them: The regression function should produce coefficient estimates nearly identical to lm() in R The function should also produce 95% confidence intervals for the coefficient estimates. I’d like to estimate these via bootstrapping but we will see. The regression function should also produce an overall p-value for the model. “From scratch” here is a bit ill-defined but I intend to write this at the level of calling the matrix operations from a package like numpy but not writing my own matrix inversion function or the like. I’ll provide updates on the process as I go.]]></summary><media:thumbnail xmlns:media="http://search.yahoo.com/mrss/" url="https://aaronspringer.org/assets/images/markdown.jpg" /><media:content medium="image" url="https://aaronspringer.org/assets/images/markdown.jpg" xmlns:media="http://search.yahoo.com/mrss/" /></entry><entry><title type="html">Do Something Unproductive</title><link href="https://aaronspringer.org/do-something-unproductive/" rel="alternate" type="text/html" title="Do Something Unproductive" /><published>2021-04-10T12:19:00+00:00</published><updated>2021-04-10T12:19:00+00:00</updated><id>https://aaronspringer.org/do-something-unproductive</id><content type="html" xml:base="https://aaronspringer.org/do-something-unproductive/"><![CDATA[<p>Do something unproductive today. At least an hour. Maybe more. This isn’t a life-hack to increase your productivity later. That’s not the point.</p>

<p>I don’t even care what you do—as long as it’s unproductive. It could even be fun. Play a video game you’ve been eyeing. Go for a walk. Read that cheap paperback you won’t admit to reading. Hell, just browse reddit for an hour. Just do something unproductive.</p>

<p>Don’t justify it. Whatever you do, don’t justify it. Don’t say “Playing this video game will give me something to talk about with my co-workers”. Don’t say “This walk is exercise and I’m becoming healthier”. Don’t try to justify it to yourself. That’s not the point.</p>

<p>If you feel guilty doing this, that’s ok. Sit with the feeling and it will go away.</p>]]></content><author><name>aaronspringer</name></author><category term="blog" /><summary type="html"><![CDATA[Do something unproductive today. At least an hour. Maybe more. This isn’t a life-hack to increase your productivity later. That’s not the point. I don’t even care what you do—as long as it’s unproductive. It could even be fun. Play a video game you’ve been eyeing. Go for a walk. Read that cheap paperback you won’t admit to reading. Hell, just browse reddit for an hour. Just do something unproductive. Don’t justify it. Whatever you do, don’t justify it. Don’t say “Playing this video game will give me something to talk about with my co-workers”. Don’t say “This walk is exercise and I’m becoming healthier”. Don’t try to justify it to yourself. That’s not the point. If you feel guilty doing this, that’s ok. Sit with the feeling and it will go away.]]></summary><media:thumbnail xmlns:media="http://search.yahoo.com/mrss/" url="https://aaronspringer.org/assets/images/markdown.jpg" /><media:content medium="image" url="https://aaronspringer.org/assets/images/markdown.jpg" xmlns:media="http://search.yahoo.com/mrss/" /></entry><entry><title type="html">Algorithmic Bias is Not Just Data Bias</title><link href="https://aaronspringer.org/not-just-data-bias/" rel="alternate" type="text/html" title="Algorithmic Bias is Not Just Data Bias" /><published>2018-10-15T12:19:00+00:00</published><updated>2018-10-15T12:19:00+00:00</updated><id>https://aaronspringer.org/not-just-data-bias</id><content type="html" xml:base="https://aaronspringer.org/not-just-data-bias/"><![CDATA[<p>This myth is perpetuated across message boards to research articles and everything in between. It is so widespread that I simply have to say something about it. <em>Algorithmic bias is not just data bias</em>. Sure, “data bias” may be a root cause in many algorithmic bias problems and researchers should always be well aware of the sampling characteristics of their training sets. However, algorithmic bias is not simply a problem where the algorithm was trained on a dataset that was missing information or unrepresentative of a larger population, it can be much more pernicious that that.</p>

<p>The first example is one you’re likely familiar with: COMPAS. COMPAS is a system some governments use to determine parole and sentencing in judicial settings. <a href="https://www.propublica.org/article/machine-bias-risk-assessments-in-criminal-sentencing">ProPublica wrote an article about this system and how it was biased against people of color</a>. It is impossible to know the details given the proprietary formula used for COMPAS, but it is easy to speculate that COMPAS was trained using data from the current judicial system.<a href="https://link.springer.com/content/pdf/10.1023/A:1015258732676.pdf">Given that our current judicial system produces harsher punishments for defendents of color</a> then it is no wonder COMPAS is biased. Isn’t this a result of a biased dataset? Not really, this data could be perfectly representative of the population it was drawn from. Even if we had all data from every parole decision ever made, we would likely get the same outcome. Our dataset is not statistically biased from the overall population. Rather, what we see in this type of data is a bias or difference from some hypothesized ‘ideal’ dataset where folks are treated fairly by our judicial system.</p>

<p>Word embeddings illustrate that ‘algorithmic bias is not just data bias’ as well. Word embeddings embody biases that are implicit in the way we talk about people. <a href="http://papers.nips.cc/paper/6227-man-is-to-computer-programmer-as-woman-is-to-homemaker-debiasing-word-embeddings">When looking at word embeddings, the professions most associated with ‘she’ contain ‘homemaker’, ‘nurse’, ‘receptionist’</a>. Most associated with ‘he’ are words like ‘captain’, ‘magician’, and ‘boss’. Is this an issue of data bias? No. Even if these word embeddings were trained on every single written English word that exists we would likely get the same outcome. These words reflect our society well. However, building upon these word embeddings could result in biases that disadvantage women using them. <a href="https://www.theguardian.com/technology/2015/jul/08/women-less-likely-ads-high-paid-jobs-google-study">Advertising higher paying jobs exclusively to men comes to mind</a>.</p>

<p>The above are just a couple examples illustrating the fact that algorithmic bias is not just data bias. Unfortunately, asserting this fact opens up an algorithmic Pandora’s Box. If algorithmic bias is always just data bias, then we can correct it by collecting more data or reweighting our sample. Unfortunately, it is not that simple. To correct these problems requires counterfactual thinking. Correcting these problems requires articulating a clear vision for what constitutes fair treatment and using newly developed techniques to enforce this when training a model. We are arriving at a world where fairness and algorithmic bias problems cannot be fixed by technical considerations; these problems must be fixed by ethical considerations.</p>]]></content><author><name>aaronspringer</name></author><category term="blog" /><category term="bias" /><category term="machine-learning" /><category term="fairness" /><summary type="html"><![CDATA[This myth is perpetuated across message boards to research articles and everything in between. It is so widespread that I simply have to say something about it. Algorithmic bias is not just data bias. Sure, “data bias” may be a root cause in many algorithmic bias problems and researchers should always be well aware of the sampling characteristics of their training sets. However, algorithmic bias is not simply a problem where the algorithm was trained on a dataset that was missing information or unrepresentative of a larger population, it can be much more pernicious that that. The first example is one you’re likely familiar with: COMPAS. COMPAS is a system some governments use to determine parole and sentencing in judicial settings. ProPublica wrote an article about this system and how it was biased against people of color. It is impossible to know the details given the proprietary formula used for COMPAS, but it is easy to speculate that COMPAS was trained using data from the current judicial system.Given that our current judicial system produces harsher punishments for defendents of color then it is no wonder COMPAS is biased. Isn’t this a result of a biased dataset? Not really, this data could be perfectly representative of the population it was drawn from. Even if we had all data from every parole decision ever made, we would likely get the same outcome. Our dataset is not statistically biased from the overall population. Rather, what we see in this type of data is a bias or difference from some hypothesized ‘ideal’ dataset where folks are treated fairly by our judicial system. Word embeddings illustrate that ‘algorithmic bias is not just data bias’ as well. Word embeddings embody biases that are implicit in the way we talk about people. When looking at word embeddings, the professions most associated with ‘she’ contain ‘homemaker’, ‘nurse’, ‘receptionist’. Most associated with ‘he’ are words like ‘captain’, ‘magician’, and ‘boss’. Is this an issue of data bias? No. Even if these word embeddings were trained on every single written English word that exists we would likely get the same outcome. These words reflect our society well. However, building upon these word embeddings could result in biases that disadvantage women using them. Advertising higher paying jobs exclusively to men comes to mind. The above are just a couple examples illustrating the fact that algorithmic bias is not just data bias. Unfortunately, asserting this fact opens up an algorithmic Pandora’s Box. If algorithmic bias is always just data bias, then we can correct it by collecting more data or reweighting our sample. Unfortunately, it is not that simple. To correct these problems requires counterfactual thinking. Correcting these problems requires articulating a clear vision for what constitutes fair treatment and using newly developed techniques to enforce this when training a model. We are arriving at a world where fairness and algorithmic bias problems cannot be fixed by technical considerations; these problems must be fixed by ethical considerations.]]></summary><media:thumbnail xmlns:media="http://search.yahoo.com/mrss/" url="https://aaronspringer.org/assets/images/markdown.jpg" /><media:content medium="image" url="https://aaronspringer.org/assets/images/markdown.jpg" xmlns:media="http://search.yahoo.com/mrss/" /></entry><entry><title type="html">Algorithmic Whitewashing</title><link href="https://aaronspringer.org/algorithmic-whitewashing/" rel="alternate" type="text/html" title="Algorithmic Whitewashing" /><published>2018-02-12T12:19:00+00:00</published><updated>2018-02-12T12:19:00+00:00</updated><id>https://aaronspringer.org/algorithmic-whitewashing</id><content type="html" xml:base="https://aaronspringer.org/algorithmic-whitewashing/"><![CDATA[<p>Whitewashing in the film industry particularly came to a head with the release of Ghost in the Shell in which Scarlett Johansson was cast to play an Asian heroine. Online communities responded strongly, <a href="https://www.huffingtonpost.com/2015/01/15/petition-scarlett-johansson-ghost-in-shell_n_6481288.html">starting a petition to rescind her role as the main character</a>. <a href="https://www.huffingtonpost.com/summer-noble/why-scarlett-johansson-st_b_6466498.html">Activists declared that this was an act of ‘whitewashing’</a>; the act of taking a culturally important story to a non-dominant group and appropriating it, thereby displacing many cultural elements by casting a white actor in a non-white role. Now imagine this act of whitewashing, but on a scale that affects millions of people daily-taking culturally important elements and instead replacing them with similar elements from the dominant culture.</p>

<p>Current speech services offered by Google, Microsoft, and Amazon whitewash the speech of non-dominant groups. One of the many ways that speech interfaces err is by taking speech from different dialects and whitewashing it to Standard American English1. This whitewashing is essentially an algorithmic microagression, a user could request the song “You Da Baddest” from Cortana or Google Assistant and see the system, in real time, take their speech and attempt to change it into a more Standard American English “You’re the Baddest”. It’s almost as if there is someone standing there and reprimanding them while they are speaking. This whitewashing can lead to errors in retrieving content created by these same cultures. The systems add insult to injury, not only did the user see their speech turned into something they never said, the intended content now cannot even be retrieved because of this transformation.</p>

<p>This is a form of algorithmic bias; algorithmic bias has been characterized and tied to different decisions made by teams when creating the algorithm. The way that speech recognition normally works is to attempt to turn each sound bite someone says into its corresponding text word. However, since it is very easy to miss a single word along the way, speech recognition systems take all these possible words and then look to see if it is a reasonable sentence. For example, the algorithm could make a simple error and accidentally transcribe the word ‘ate’ as ‘hate’ in the sentence ‘I hate a fish yesterday’. To us, it is immediately apparent that this sentence contains an error. However, for a speech recognition system to determine this, it looks at millions of examples it has seen of sentences and phrases and quickly determines that:</p>
<ol>
  <li>‘I hate a fish yesterday’ occurs very rarely</li>
  <li>‘I ate a fish yesterday’ occurs very often</li>
  <li>The audio of these two sentences are very close to each other and ‘I ate a fish yesterday’ is likely what was actually said.</li>
</ol>

<p>This same phenomenon leads to algorithmic whitewashing. Other songs like ‘hunnid on the drop’ are whitewashed to ‘hunted on the drop’. It is very likely that this occurs because the language model of the ASR being used has not been fed many examples of this non-dominant form of speech. Therefore, rather than recognizing it as a legitimate way of speaking, it attempts to find the closest parallel in Standard American English. These Standard American English parallels must occur so overwhelmingly often in the language model that even when the sentence is quite phonetically different, the algorithm still chooses to transcribe the Standard American English parallel. This bias has widespread consequences.</p>

<p>Algorithmic whitewashing is cultural suppression. Language is one of the most powerful parts of culture and taking these cultural patterns of speech and replacing them with the dominant patterns of speech further suppresses already threatened cultural identities. Rather than assaulting these cultural markers, applications should be empowering these groups to speak their natural language. After all, often the cases where this whitewashing is most apparent are when users ask for culturally significant media from their own culture. We glorify these artists; we should empower the cultures that created them.</p>

<p>References</p>
<ol>
  <li>Aaron Springer and Henriette Cramer. 2018. “Play PRBLMS”: Identifying and Correcting Less Accessible Content in Voice Interfaces. CHI 2018.</li>
</ol>]]></content><author><name>aaronspringer</name></author><category term="blog" /><category term="bias" /><category term="machine-learning" /><summary type="html"><![CDATA[How Speech Recognition Supresses Cultural Speech]]></summary><media:thumbnail xmlns:media="http://search.yahoo.com/mrss/" url="https://aaronspringer.org/assets/images/markdown.jpg" /><media:content medium="image" url="https://aaronspringer.org/assets/images/markdown.jpg" xmlns:media="http://search.yahoo.com/mrss/" /></entry><entry><title type="html">Defining Algorithmic Bias</title><link href="https://aaronspringer.org/algobias-overview/" rel="alternate" type="text/html" title="Defining Algorithmic Bias" /><published>2017-12-20T12:19:00+00:00</published><updated>2017-12-20T12:19:00+00:00</updated><id>https://aaronspringer.org/algobias-overview</id><content type="html" xml:base="https://aaronspringer.org/algobias-overview/"><![CDATA[<p>We don’t have a good definition of <em>algorithmic bias</em>. Some say it is simply when algorithms’ training data differs from a true distribution. Others argue algorithmic bias requires systematic intent from the algorithm creators to disadvantage certain groups. Both of these are too narrow of a definition. <strong>Algorithmic bias is the use of any algorithm that results in a degraded experience for a group of people due to a factor unrelated to the algorithm’s purpose.</strong> Current definitions fail to encompass all algorithmic bias for 2 reasons: assumptions that algorithmic bias is only a data problem and definitions of algorithmic bias that require biased intent.</p>

<h3 id="algorithmic-bias-is-not-simply-biased-data">Algorithmic Bias is Not Simply Biased Data</h3>
<p>Machine learning communities dismiss algorithmic bias as a simple issue where the training data is not representative of the true population. For example, perhaps we are training Alexa’s voice recognition and we ended up using only voices from upper-middle class white men in the training set. <a href="https://www.technologyreview.com/s/608619/ai-programs-are-learning-to-exclude-some-african-american-voices/">This could (and did) result in Alexa not recognizing voices from other speakers</a>. This type of biased training data is a big problem but it’s not the only problem under the umbrella of algorithmic bias. Defining algorithmic bias as solely “unrepresentative training data” fails to account for the many situations where training data is representative but biased by societal decisions. For example, COMPAS is a risk assessment software that informs judges about a criminal’s predicted future offenses. Judges all over the United States use this software to help determine sentencing length and parole eligibility of criminals. <a href="https://www.propublica.org/article/machine-bias-risk-assessments-in-criminal-sentencing">However, COMPAS is biased against African-Americans.</a> COMPAS is far more likely to rate African-Americans as likely reoffenders even if this isn’t borne out by the data afterwards. COMPAS is a case where the training data being unrepresentative isn’t the only issue to tackle. A bigger problem with COMPAS is that it embodies the <a href="https://scholar.google.com/scholar?hl=en&amp;as_sdt=0%2C14&amp;as_vis=1&amp;q=sentencing+biases+in+american+legal+system&amp;btnG=">societal biases that judges and juries pass on to African-American defendants within the court system</a>. <em>The problem may be that COMPAS is actually too representative of our legal system.</em> COMPAS learned that defendants of color are judged more harshly and therefore predict that their chance of serious re-offenses is more likely.. Algorithmic bias is not solely a problem with the data.</p>

<h3 id="algorithmic-bias-is-often-unintentional">Algorithmic Bias is Often Unintentional</h3>
<p>Academics such as Friedman and Nissenbaum (2001) argue that algorithmic bias pertains to “computer systems that systematically and unfairly discriminate against certain individuals or groups of individuals in favor of others”. While Friedman and Nissenbaum’s work was prescient in many ways, their definition of algorithmic bias here fails for one reason. “Systematically” implies an intentional and methodical process that creators engage in to disadvantage certain users. This definition was written in a time where machine learning was not as widely deployed as today. Friedman and Nissenbaum’s examples are systems like <a href="https://en.wikipedia.org/wiki/Sabre_(computer_system)#Controversy">SABRE</a> that were intentionally biased by programmers towards a specific outcome. Such intentional biasing is likely less common today than the unintentional biases in every intelligent system. <em>Algorithmic bias is not often systematic, but it is often systemic.</em></p>

<h3 id="a-working-definition">A Working Definition</h3>
<p>Algorithmic bias is the use of any algorithm that results in a degraded experience for a group of people due to a factor unrelated to the algorithm’s purpose. This broadens the above two definitions to include other phenomena that would fall under colloquial definitions of algorithmic bias but not under the definitions proposed by others. For example, <a href="https://qz.com/857122/an-algorithm-rejected-an-asian-mans-passport-photo-for-having-closed-eyes/">a passport photo service that would not let a user progress and kept informing them to “open their eyes” when the user uploaded a picture of themselves.</a> This problem cannot be explicitly attributed to biased data or programmer intent and thus would not fall into the above definitions. However, this user (and likely many others) had a degraded experience due to their facial features that are characteristic of their heritage. The user’s facial features should really have no impact on whether or not they receive a passport and thus this is also a factor unrelated to the algorithm’s purpose. Together these two criteria are met and thus this situation falls under the definition of algorithmic bias in this article. Does this mean algorithmic bias is ubiquitous in every system? It just might.</p>]]></content><author><name>aaronspringer</name></author><category term="blog" /><category term="bias" /><category term="machine-learning" /><summary type="html"><![CDATA[How do we define algorithmic bias?]]></summary><media:thumbnail xmlns:media="http://search.yahoo.com/mrss/" url="https://aaronspringer.org/assets/images/markdown.jpg" /><media:content medium="image" url="https://aaronspringer.org/assets/images/markdown.jpg" xmlns:media="http://search.yahoo.com/mrss/" /></entry><entry><title type="html">Algorithmic Bias in Voice Interfaces</title><link href="https://aaronspringer.org/algobias/" rel="alternate" type="text/html" title="Algorithmic Bias in Voice Interfaces" /><published>2017-12-11T22:48:00+00:00</published><updated>2017-12-11T22:48:00+00:00</updated><id>https://aaronspringer.org/algobias</id><content type="html" xml:base="https://aaronspringer.org/algobias/"><![CDATA[<p>Current voice interfaces can act as exclusionary gatekeepers with regards to accessing content. The exclusion may result from different phenomena that would fall under the umbrella of algorithmic bias. The problem could be unrepresentative data, homogenous testing teams, poor sampling strategies, or any other one of hundreds of steps that could insert bias into a program. Unfortunately, all current voice interfaces suffer from this algorithmic bias in different forms. <strong>I set out to detect specific biases and create a lightweight process to correct them within a voice interface.</strong></p>

<p>A huge problem with algorithmic bias work is discovering what the exact biases are. Is the voice interface biased against women’s voices? Or is it against specific accents? Which accents? Maybe it has issues with children’s voices. The possibility space is huge and manually testing all of these by bringing in the specific users for studies is simply infeasible. Realizing that the problem of discovering specific biases could not be approached this way, I reframed the problem in a more efficient way. Rather than looking for specific biases, I began looking for specific pieces of content that suffered from being excluded by the voice interface. This still was not an easy task but this reframing made the problem tractable.</p>

<p>I don’t want to spoil everything here so watch out for my paper “Play PRBLMS”: Identifying and Correcting Less Accessible Content in Voice Interfaces at CHI 2018!</p>]]></content><author><name>aaronspringer</name></author><category term="project" /><category term="bias" /><category term="voice-interface" /><category term="UXOFAI" /><summary type="html"><![CDATA[Developed a novel method to recognize algorithmic bias in voice interfaces and a process to collect additional data to counteract these biases]]></summary><media:thumbnail xmlns:media="http://search.yahoo.com/mrss/" url="https://aaronspringer.org/assets/images/markdown.jpg" /><media:content medium="image" url="https://aaronspringer.org/assets/images/markdown.jpg" xmlns:media="http://search.yahoo.com/mrss/" /></entry><entry><title type="html">User Perceptions of Intelligent Systems</title><link href="https://aaronspringer.org/emeter/" rel="alternate" type="text/html" title="User Perceptions of Intelligent Systems" /><published>2017-09-22T22:48:00+00:00</published><updated>2017-09-22T22:48:00+00:00</updated><id>https://aaronspringer.org/emeter</id><content type="html" xml:base="https://aaronspringer.org/emeter/"><![CDATA[<div class="side-by-side">
    <div class="toleft">
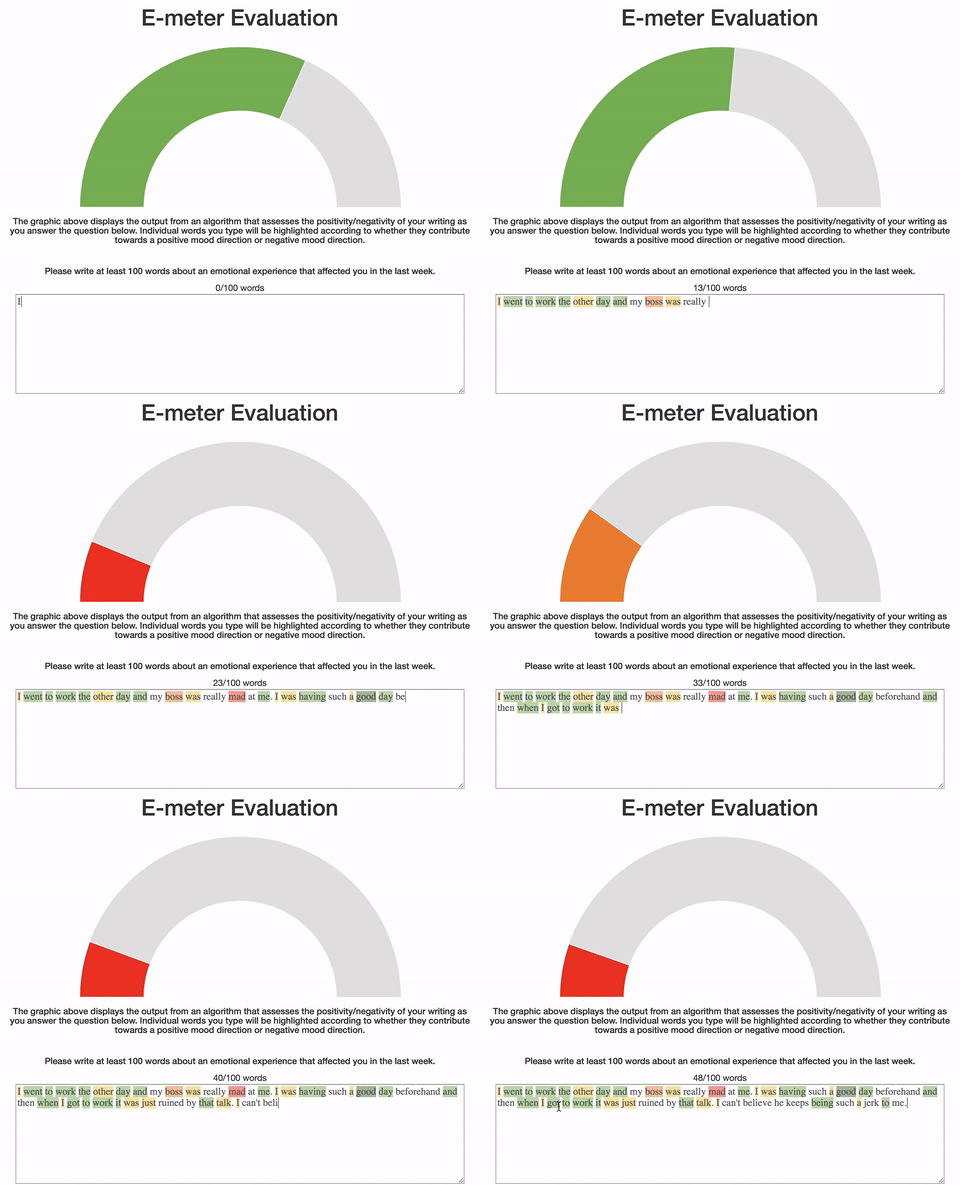
        <img class="image" src="https://aaronspringer.org/assets/images/gifofemeter.gif" alt="Alt Text" />
        <figcaption class="caption">The E-meter accurately predicting the mood of a user writing a diary entry in real time. Transparent highlighting shows the contribution of each word towards the overall score.</figcaption>
    </div>

    <div class="toright">
        <p>The E-meter, take what you will from the name, is an application designed to better understand how people understand and build mental models of intelligent systems based on machine learning. Users are asked to write about emotional experiences that they have had in the past week. While they are writing the E-meter judges the mood of their entry from positive to negative. Users then complete a survey designed to examine the biases they experienced while using the E-meter, their trust and perceptions of accuracy, and other questions targeting user experience.</p>
    </div>
</div>

<h3 id="what-did-we-find">What did we find?</h3>
<p>Our first experiment used an E-meter that was not even powered by machine learning. It was simply moving randomly as users typed words into the text box. Surprisingly, a lot of users were fooled by this. <strong>Many users could not even tell that the E-meter was moving randomly.</strong> The users experienced biases that led to them believing the system even when it was wrong. <strong>Most concerning, some users seemed to believe that they system was a more accurate judge of the users’ emotions than the users themselves.</strong> We need to be careful how we design intelligent systems in order to counteract these biases users are prone to.</p>

<p>Our second experiment examined the E-meter in the context of real-usage. We developed a regression model that predicted mood of the users’ entries from their writing. We split out users into 2 conditions. First, a transparent condition, where users saw each word they wrote highlighted in a way that showed whether it contributed positively or negatively to their overall mood score. Second, an opaque condition where users did not see this highlighting. We found a complex interaction between transparency and users’ perceptions of accuracy. <strong>When the E-meter predicted accurately for a user, transparency negatively affected the user’s perception of the E-meter’s accuracy.</strong> When the E-meter was very inaccurate, predicting the opposite of what a user felt, transparency increased the users’ perceptions of E-meter accuracy. In human to human interactions we see a similar phenomenon, people often only desire explanation when the actions another person took are unexpected.</p>]]></content><author><name>aaronspringer</name></author><category term="project" /><category term="e-meter" /><category term="mood" /><category term="machine-learning" /><category term="expectation-violation" /><category term="bias" /><summary type="html"><![CDATA[Developed an application that predicts mood from a user entering a diary entry in real time in order to examine trust and user perceptions of machine learning]]></summary><media:thumbnail xmlns:media="http://search.yahoo.com/mrss/" url="https://aaronspringer.org/assets/images/markdown.jpg" /><media:content medium="image" url="https://aaronspringer.org/assets/images/markdown.jpg" xmlns:media="http://search.yahoo.com/mrss/" /></entry><entry><title type="html">PARC Coach - Enabling Healthy Behaviors</title><link href="https://aaronspringer.org/parccoach/" rel="alternate" type="text/html" title="PARC Coach - Enabling Healthy Behaviors" /><published>2016-10-06T22:48:00+00:00</published><updated>2016-10-06T22:48:00+00:00</updated><id>https://aaronspringer.org/parccoach</id><content type="html" xml:base="https://aaronspringer.org/parccoach/"><![CDATA[<div class="side-by-side">
    <div class="toleft">
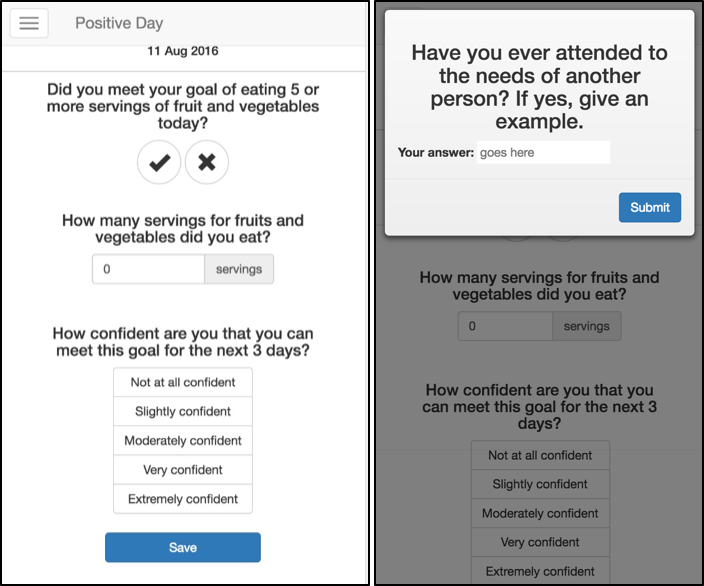
        <img class="image" src="https://aaronspringer.org/assets/images/parccoach1.png" alt="Alt Text" />
        <figcaption class="caption">PARC Coach Logging Screen and Example of a Small Dose Self-Affirmation Question Designed to Improve Health Behavior Change</figcaption>
    </div>

    <div class="toright">
        <p>PARC Coach was a program that I designed while interning at Xerox PARC. The program helps users achieve their goals of consuming the recommended amount of fruit and vegetables per day using a psychological manipulation called self-affirmation exercises. Self-affirmation exercises are small tasks that participants engage in that allow users to reflect on the guiding values in their life, this in turn can increase health behavior change and acceptance of threatening health information. Unfortunately, no research had explored dosing effects of self-affirmation or how to translate it from the lab setting to the chaotic mobile space. My research bridged this transition and found dose-dependent effects of self-affirmation on health behavior change. We found that users in the condition receiving the highest dose of self-affirmation met their fruit and vegetable consumption goals 21% more than controls.</p>
    </div>
</div>]]></content><author><name>aaronspringer</name></author><category term="project" /><category term="self-affirmation" /><category term="health-behavior-change" /><category term="PARC" /><summary type="html"><![CDATA[Mobile application using self-affirmation to help facilitate health eating among at-risk populations]]></summary><media:thumbnail xmlns:media="http://search.yahoo.com/mrss/" url="https://aaronspringer.org/assets/images/markdown.jpg" /><media:content medium="image" url="https://aaronspringer.org/assets/images/markdown.jpg" xmlns:media="http://search.yahoo.com/mrss/" /></entry><entry><title type="html">EmotiCal - Mood Regulation Through Future Mood Prediction</title><link href="https://aaronspringer.org/emotical/" rel="alternate" type="text/html" title="EmotiCal - Mood Regulation Through Future Mood Prediction" /><published>2016-09-16T22:48:00+00:00</published><updated>2016-09-16T22:48:00+00:00</updated><id>https://aaronspringer.org/emotical</id><content type="html" xml:base="https://aaronspringer.org/emotical/"><![CDATA[<div class="side-by-side">
    <div class="toleft">
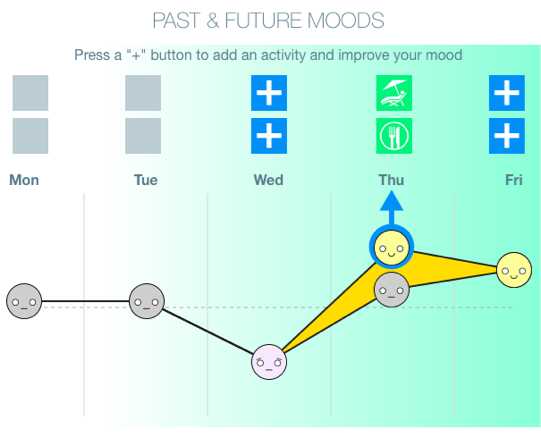
        <img class="image" src="https://aaronspringer.org/assets/images/emoticalforecast.png" alt="Alt Text" />
        <figcaption class="caption">EmotiCal Forecast Showing Expected Improvements in Mood Tomorrow</figcaption>
    </div>

    <div class="toright">
        <p>EmotiCal is a cross-platform mobile application to help normal people regulate their emotional state on a day to day basis. EmotiCal accomplishes this by predicting future moods of the user and allowing them to schedule activities that could improve their mood in future days. These activities that users can schedule are learned by EmotiCal from the daily logs that users record where they talk about the activities they engaged in and their mood overall each day.</p>
    </div>
</div>
<p> My role in this project was architecting and implementing the machine learning that powered the future mood forecasts, current mood models, and activity recommendations. I took a cue from econometrics methods in order to forecast mood. Previous research has shown that mood follows daily and weekly cycles which indicated that it may be a good fit for ARIMA style methods that could incorporate seasonality into predictions. With this knowledge, I implemented the future mood prediction as an ARIMA that tuned itself to find the right AR/MA parameters on an individual user basis.</p>
<p> In addition to predicting future mood, I also modeled current mood from activities that users reported engaging in. I implemented this as a linear regression model, this allowed for easily interpretable models that could be used for multiple purposes. Given that we were deploying this with small amounts of users in our experiments, common recommender algorithms were not a good fit. Therefore, we used this linear model to make activity recommendations to users based on the positive/negative effects of the activities they engaged. The linear model additionally helped with the mood forecast by estimating the impact that scheduling an activity would have on the mood of that future day.</p>
<p>After successful experiments indicating that EmotiCal improved emotional regulation and awareness in users (<a href="http://www.tandfonline.com/doi/abs/10.1080/07370024.2016.1277724">published in HCI journal here</a>), I engaged in a post-hoc analysis of much of the data. I examined how using general mood models compared to personalized models for each user. I proposed a solution to the cold start problems of these models starting without data by clustering users into subgroups and using these subgroups for recommendation. Additionally, I examined how users talked about mood and how to predict the mood of a user just from the text they had written about their day. <a href="/emeter/">These textual models were later used in some of my E-meter experiments</a>.</p>

<p>Overall this project taught me about the tradeoffs needing to be made in implementing machine learning models for use with real users. It also seeded many thoughts about how users were interacting with our algorithms and building mental models of our system. These thoughts influenced by dissertation proposal to examine the user experience of machine learning systems.</p>]]></content><author><name>aaronspringer</name></author><category term="project" /><category term="emotical" /><category term="machine-learning" /><category term="mood" /><category term="UXofAI" /><summary type="html"><![CDATA[Mobile application forecasting user futures moods and recommending positive activities]]></summary><media:thumbnail xmlns:media="http://search.yahoo.com/mrss/" url="https://aaronspringer.org/assets/images/markdown.jpg" /><media:content medium="image" url="https://aaronspringer.org/assets/images/markdown.jpg" xmlns:media="http://search.yahoo.com/mrss/" /></entry></feed>